

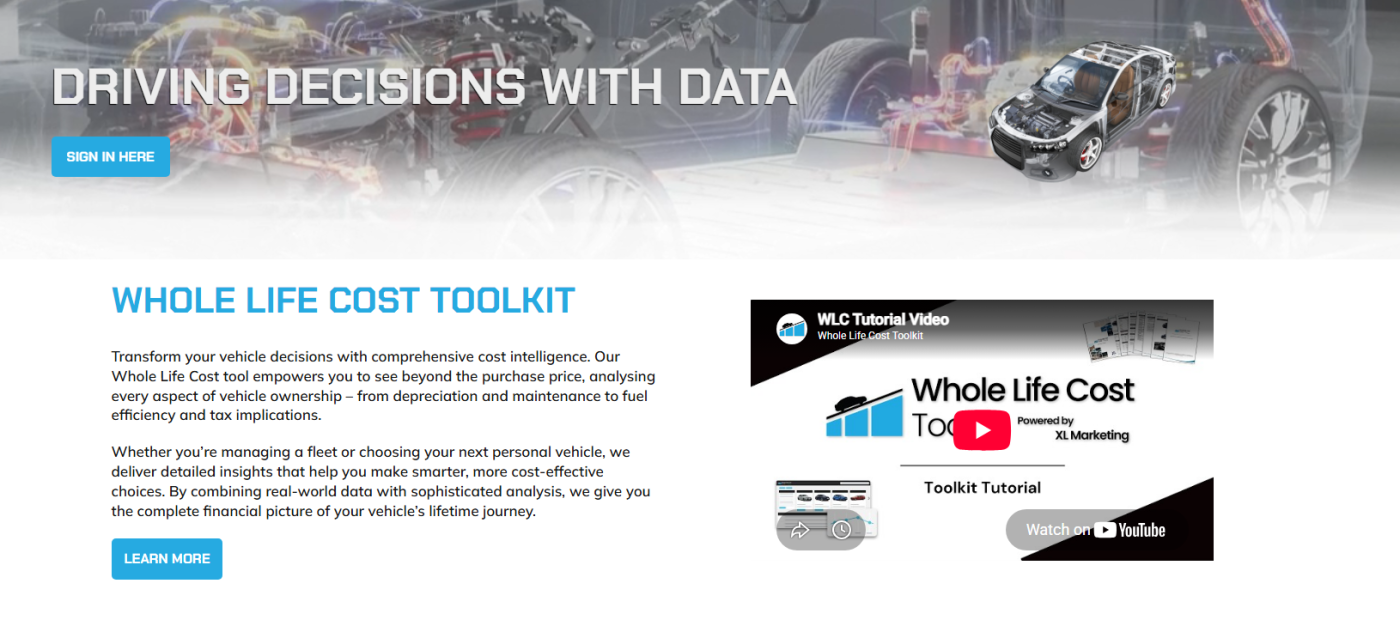
Whole Life Cost Toolkit v2.0 now live
Every fleet manager knows the feeling. A vehicle looks like a bargain on the quote, then the bills start to arrive. Fuel, servicing, tyres, insurance, tax and depreciation all take their share. Within a few years, the cheap option can become the costliest vehicle on the books.
Whole life cost analysis sets out to solve that problem. This article describes the main features of the Whole Life Cost Toolkit and explains how fleet and transport managers can use them to make sharper, better-informed decisions.
Why the Purchase Price Tells Only Part of the Story
The purchase price or monthly rental tends to dominate a procurement discussion. It is easy to compare, and it appears in black and white on every quotation. Yet it describes only a fraction of what a vehicle will cost the business over its working life.
Whole life cost, sometimes called total cost of ownership, takes a wider view. It adds up every pound spent on a vehicle from the day it arrives until the day it leaves the fleet. That includes depreciation, fuel, maintenance, insurance and tax. It also covers the eventual disposal value, which many quotations ignore.
The difference can be large. Two vans with similar list prices may behave very differently once they are on the road. One may use less fuel, need fewer visits to the workshop and hold its value better at resale. The other may look attractive at the outset but cost thousands more by the time the business sells it. Without a clear method for comparing them, managers must rely on instinct, and instinct rarely captures every variable.
The Whole Life Cost Toolkit aims to replace that guesswork with data. It lets managers compare vehicles on the same basis, with the full financial picture in front of them.
What the Whole Life Cost Toolkit Does
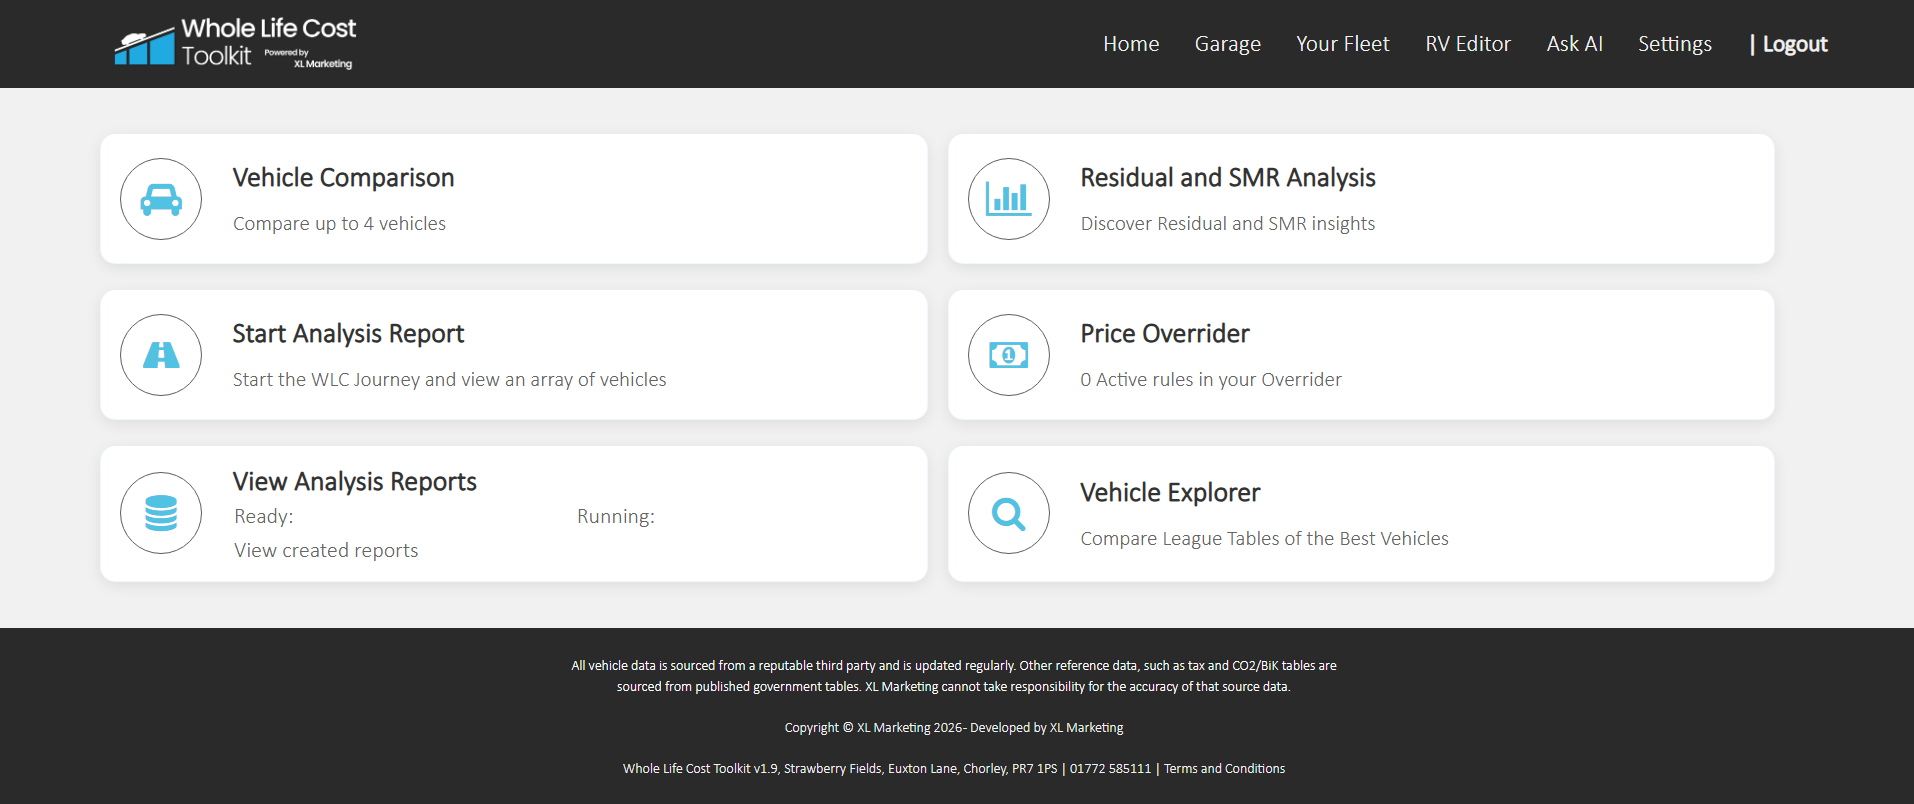
The Whole Life Cost Toolkit is an online platform from XL Marketing, a company that specialises in automotive marketing. Its purpose is simple. It calculates what a vehicle will cost to own and operate across its full lifecycle. It then presents the results in a form that decision-makers can act on.
The platform combines real-world data with detailed analysis. That combination matters. A calculator that relies on generic assumptions can mislead as easily as it can help. By working from current market information, the toolkit gives managers figures that reflect the conditions they actually face.
The tool serves several audiences. Fleet and transport managers are the primary users, since they must balance operational demands against tight budgets across many vehicles at once. The same platform also suits small business owners and private individuals who want to choose their next car or van with more confidence.
The toolkit also looks forward as well as back. Users can model how costs may change over time, which supports long-term financial planning. Instead of reacting to a tax rise or a shift in values after the event, managers can test scenarios in advance. They can then see which vehicles hold up best.
The toolkit sits within a wider family of products. These include new vehicle data, registered vehicle data, vehicle images, residual data and service and repair data, so organisations can draw on the pieces they need.
Tackling Depreciation and Residual Value
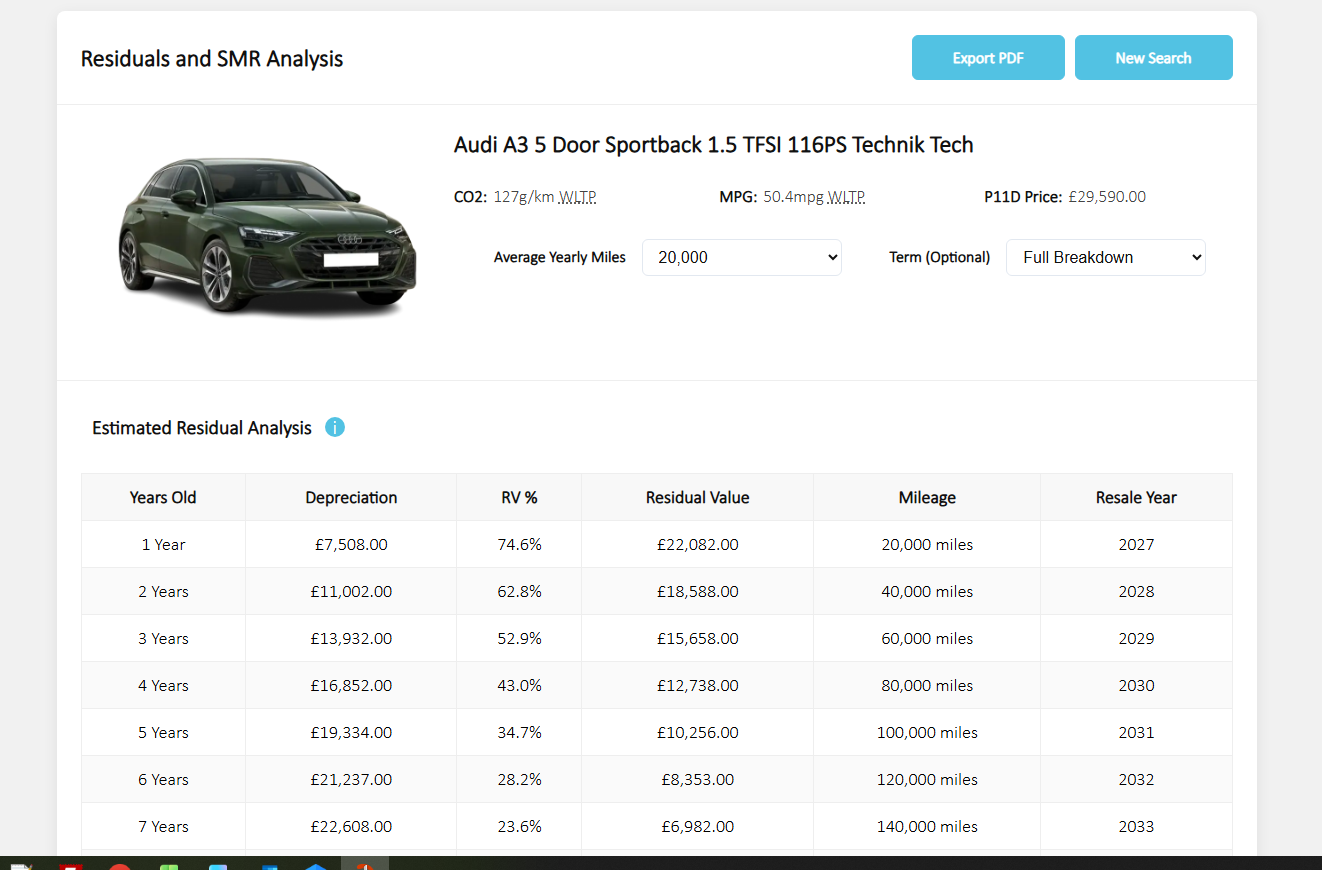
Depreciation is usually the biggest single cost of owning and operating a vehicle. It measures the gap between what the business pays for a vehicle and what it recovers at sale. Cars and vans lose value at different rates, so a model with a lower price can still lose more money overall.
The toolkit lets managers compare those rates for the vehicles they are considering. It also allows them to weigh the costs of new against used, which matters when budgets are tight or delivery times are long. A nearly new vehicle may avoid the steepest early losses, while a new one may offer lower running costs and warranty cover.
Behind the comparison sits a residual value model. According to the site, specialists create it every month from several sources, and in-house industry experts maintain it. A separate residual data product extends this forecasting, with valuations projected up to ten years ahead. That helps managers choose when to sell, as well as what to buy.
Residual values also shape leasing decisions. When managers understand which models hold their value, they negotiate from a stronger position. They can judge whether a lease rate is fair and decide whether leasing or buying suits their cash flow better. Strong residual values can offset a higher purchase price many times over, and the toolkit puts figures on that effect.
For a fleet that replaces vehicles on a regular cycle, small gains here multiply quickly. A few hundred pounds saved on each vehicle becomes a meaningful sum across the whole fleet.
Forecasting Service, Maintenance and Repair Costs
Maintenance is the cost that surprises managers most often. Routine servicing is predictable, but brakes, tyres, clutches and electrical faults arrive on their own schedule. The toolkit tackles this with forecasts for service, maintenance and repair costs across thousands of vehicles.
The forecasts start with real figures. They draw on manufacturer main dealer service costs, together with the prices of replacement parts and common repairs, including critical components. The team then adds its own predictions of how long components last and when they tend to fail. The result is a forward-looking estimate, not just a record of past bills.
This detail helps in two ways. First, it reveals differences between models that look similar on a spec sheet. One van may need an expensive service interval or a costly part that another avoids. Second, it supports better workshop planning, because managers can anticipate when major work is likely to arrive.
The Whole Life Cost Toolkit is also expanding its coverage into the electric vehicle market. That matters because many fleets have less experience of servicing electric vehicles over several years. Reliable forecasts reduce the uncertainty that often slows decisions about electrification.
Fewer surprises mean fewer unplanned costs. They also mean fewer vehicles off the road at awkward moments. For transport managers, whose vehicles earn money only when they move, that advantage carries real weight.
Making Sense of Tax: BiK, National Insurance and Road Tax
Tax has always formed part of whole life cost, but recent changes have made it harder to ignore. The toolkit includes a Benefit in Kind (BiK) calculator for company car and van drivers. It helps managers and drivers find the most tax-efficient vehicle.
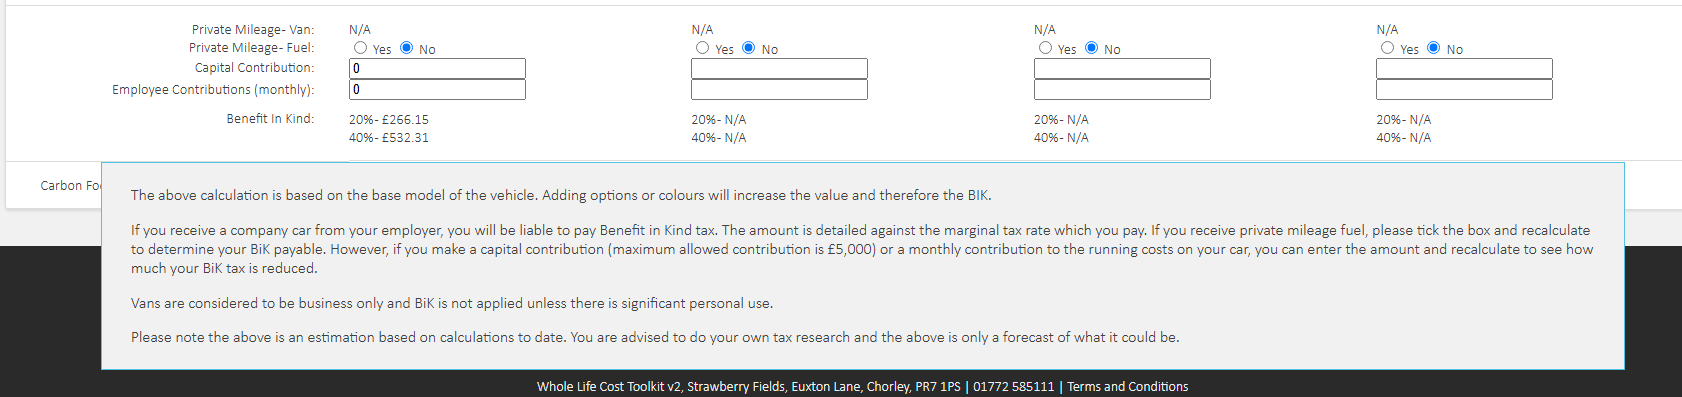
Users can adjust the calculation to reflect real circumstances. They can account for private mileage fuel, for a capital contribution from the driver, and for a monthly contribution towards private use. An employer’s National Insurance calculator sits alongside it. That figure updates automatically whenever the BiK inputs change, so the business sees the full cost of each arrangement.
The Whole Life Cost Toolkit also compares road tax across vehicles and shows the road cost over a vehicle’s life. Significant amendments to vehicle excise duty (VED) and the expensive car supplement (ECS) took effect on 1 April 2025. VED rates now rise in line with the Retail Prices Index, and zero-emission vehicles lost their exemption. Electric vehicles pay £10 in the first year and a standard annual charge of £195 after that. The ECS adds £410 a year for vehicles with a list price above £40,000.
These amounts may look small for one vehicle. Across a large fleet, they add up fast. The toolkit also reports each vehicle’s carbon footprint, which helps businesses track environmental performance. Because rates and thresholds keep changing, managers should always check current figures before they commit.
Finding and Comparing the Right Vehicles
A search facility helps managers find the right make and model. The market offers so many variants and powertrains that building a shortlist by hand can take days. Users set the criteria that matter to their operation, such as fuel efficiency, payload capacity, load volume and fuel type. The system then produces a curated list of vehicles that fit.
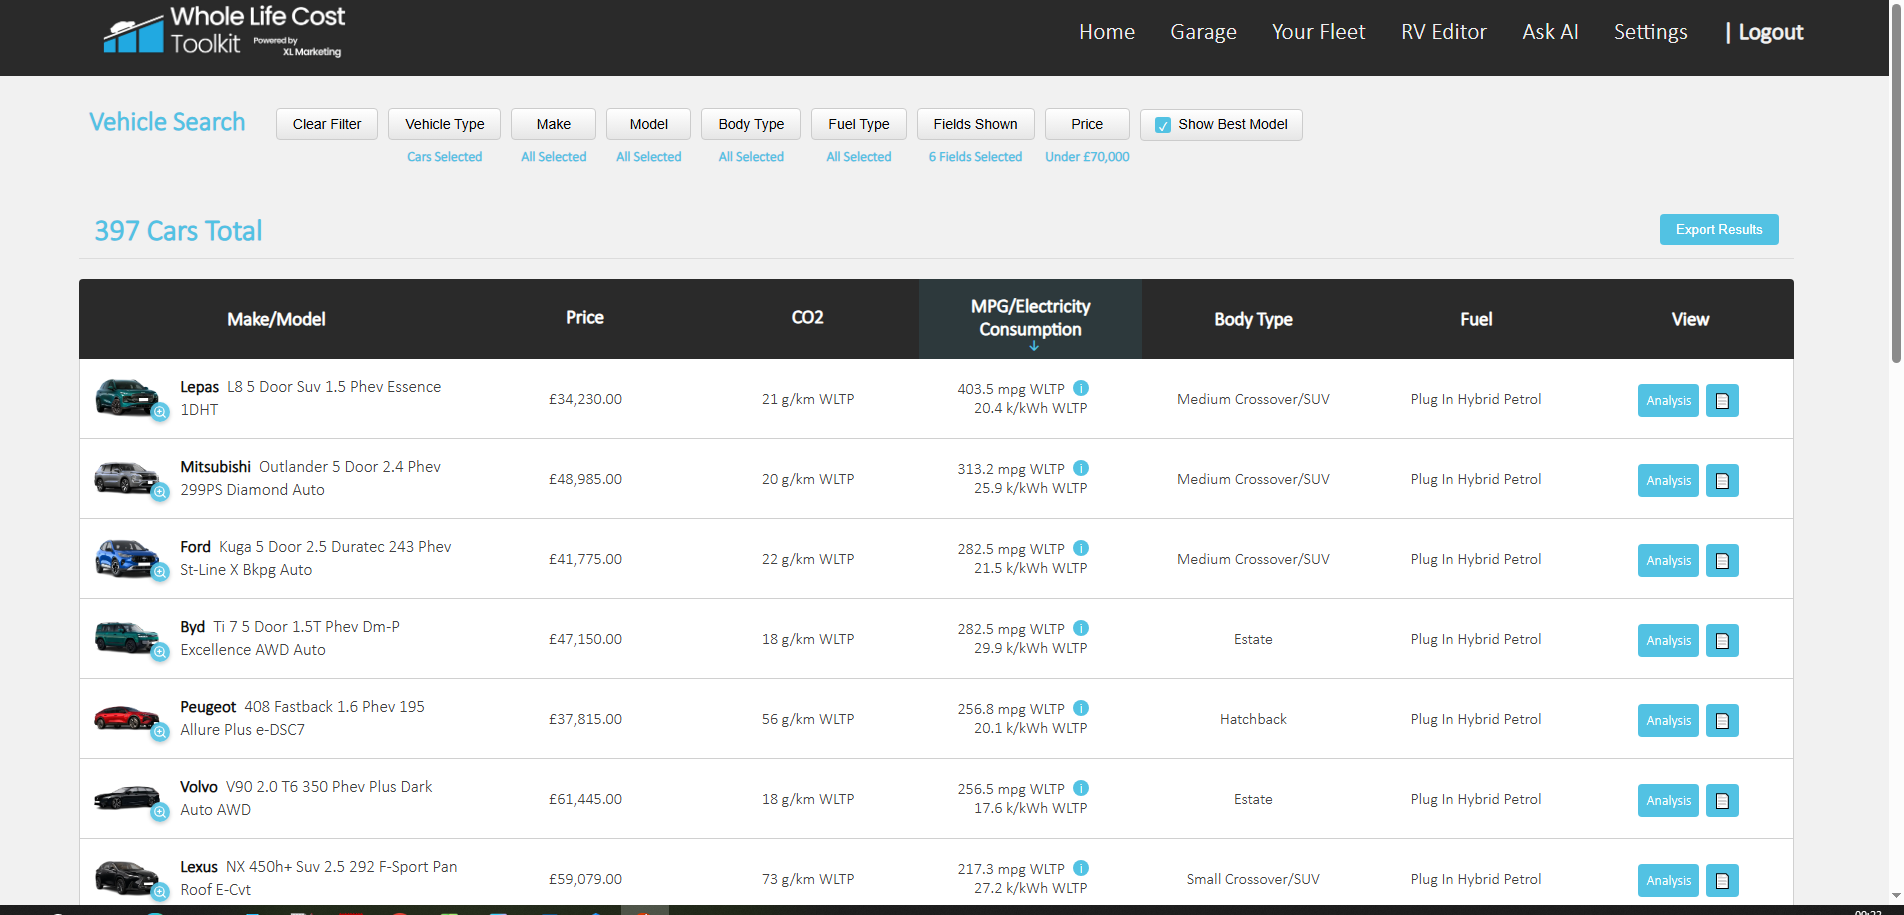
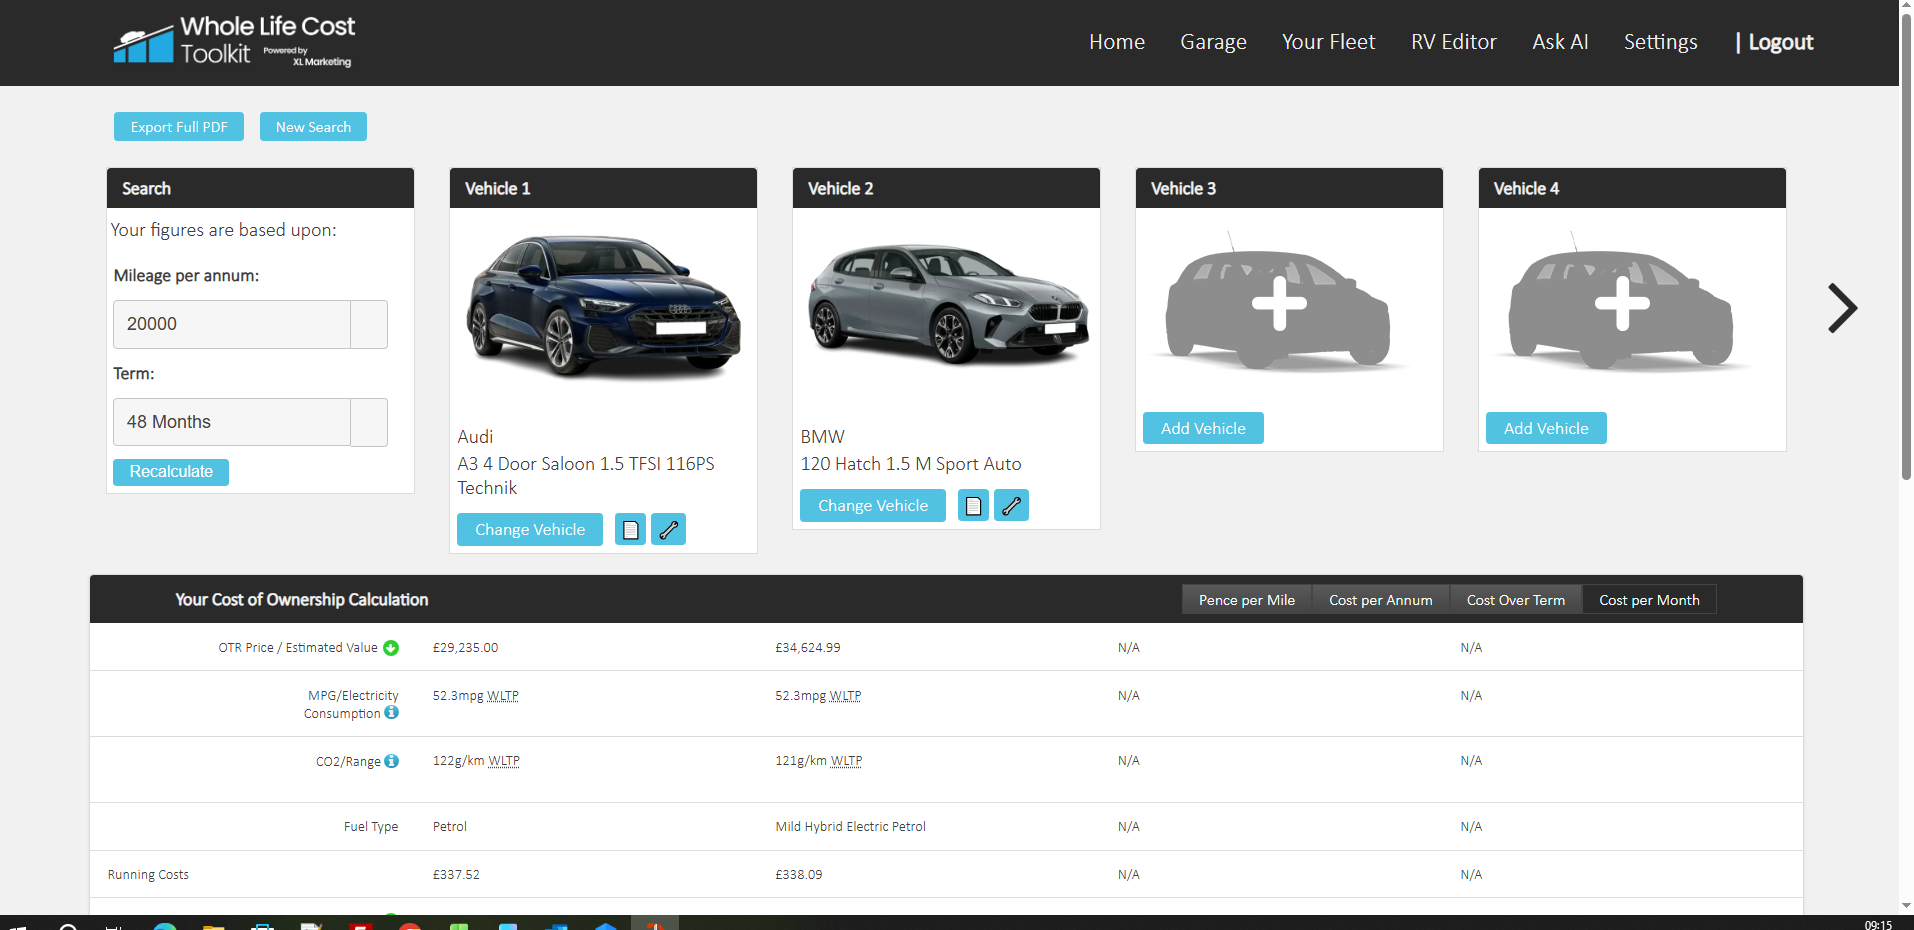
From there, the analysis tool takes over. Managers can compare up to four vehicles side by side, with all their operating and running costs on one screen. That makes trade-offs visible at a glance. A van with a slightly higher price may show lower fuel, maintenance and tax costs, and the comparison proves it.
Consider a parcel delivery firm working in city centres. It may prioritise efficiency and a low-emission powertrain for urban routes. A construction firm hauling heavy materials will care more about payload. Both can set their own criteria and see a shortlist built around their needs.
The tool also supports fleet policy. When a business sets rules for which vehicles drivers may choose, it needs objective evidence. A side-by-side comparison gives managers a firm basis for those rules, and it makes them easier to explain to employees.
This approach removes much of the guesswork from procurement. It also speeds up decisions when managers must review quotes, secure stock and meet replacement deadlines.
The Benefits for Fleet and Transport Managers
The benefits for fleet and transport managers fall into several areas.
Procurement improves first. Managers can compare vehicles on equal terms, rather than weighing a low monthly rental against a high fuel bill by feel. The toolkit shows which vehicles align with both budget and operational goals, whether that means low-emission electric vans or robust hybrids.
Trust in the data matters too. The toolkit’s website describes its figures as “totally independent of manufacturers with no bias.” Managers who face sales pitches from every direction value an impartial reference point.
Budgeting becomes more reliable. When a manager knows the likely cost of each vehicle across its life, forecasts carry more weight. Finance directors prefer evidence to estimates, and a clear whole life cost figure makes the case for a chosen vehicle much easier to defend.
Risk falls as well. A vehicle that looks economical on paper but carries heavy running costs can drain a budget for years. By putting total cost ahead of short-term savings, the toolkit helps managers avoid that trap. Getting the choice right at the start delivers savings that no later negotiation can match.
Replacement timing improves, too. The data shows when keeping an ageing vehicle costs more than replacing it. Managers can then plan their cycles around cost rather than habit.
Supporting the Move to Electric and Mixed Fleets
Many fleets now face a bigger question than which van to buy next. They must decide how and when to move towards electric and hybrid vehicles. Whole life cost analysis suits that challenge well, because electric models often carry a higher purchase price but lower operating costs.
The toolkit’s guidance explains that a vehicle which looks expensive upfront can prove cheaper over its lifetime. Energy costs, servicing needs, tax treatment and residual values all differ between powertrains. Comparing them on purchase price alone would mislead. A whole life view lets managers test diesel, petrol, hybrid and electric options against their own duty cycles.
That matching process also guards against poor specification. Over-specified vehicles waste money on capability the business never uses. Under-specified vehicles struggle with the work and wear out early. By analysing operational data, managers can fit each vehicle to its role, so every one in the fleet earns its place.
Mixed fleets benefit in particular. A business running cars, light vans and larger commercial vehicles needs a consistent method to compare them all. A single platform gives managers one process rather than several. It also helps with reporting. When every decision rests on the same method, managers can show colleagues, auditors and board members not just what they chose but why.
Getting Started with the Toolkit
The toolkit is available through Whole Life Cost Toolkit . To get a further insite into the power the Whole Life Cost Toolkit offers, view the Youtube video available on the Home page.
XL Marketing offers a free trial, and the team can be reached on 01772 585111. Managers who want to test it can register through the website and explore the features with their own vehicles in mind.
A sensible first step is to pick a recent procurement decision and run the numbers again. Compare the vehicle the business chose with two or three alternatives. Look at depreciation, running costs and tax across the full holding period. The exercise often reveals surprises, and those surprises explain why a whole life approach earns its place.
From there, managers can use the search facility to build shortlists for upcoming replacements. They can also test how forthcoming tax changes affect each option. Over time, the process becomes routine, and decisions rest on evidence rather than habit.
Whole life cost is not a new idea, but it has rarely mattered more. Taxes are rising, powertrains are diversifying and budgets remain under pressure. A tool that brings every cost together offers a practical way to stay in control. For fleet and transport managers, looking beyond the price tag is no longer optional. It is the surest route to lower costs and better vehicles.