


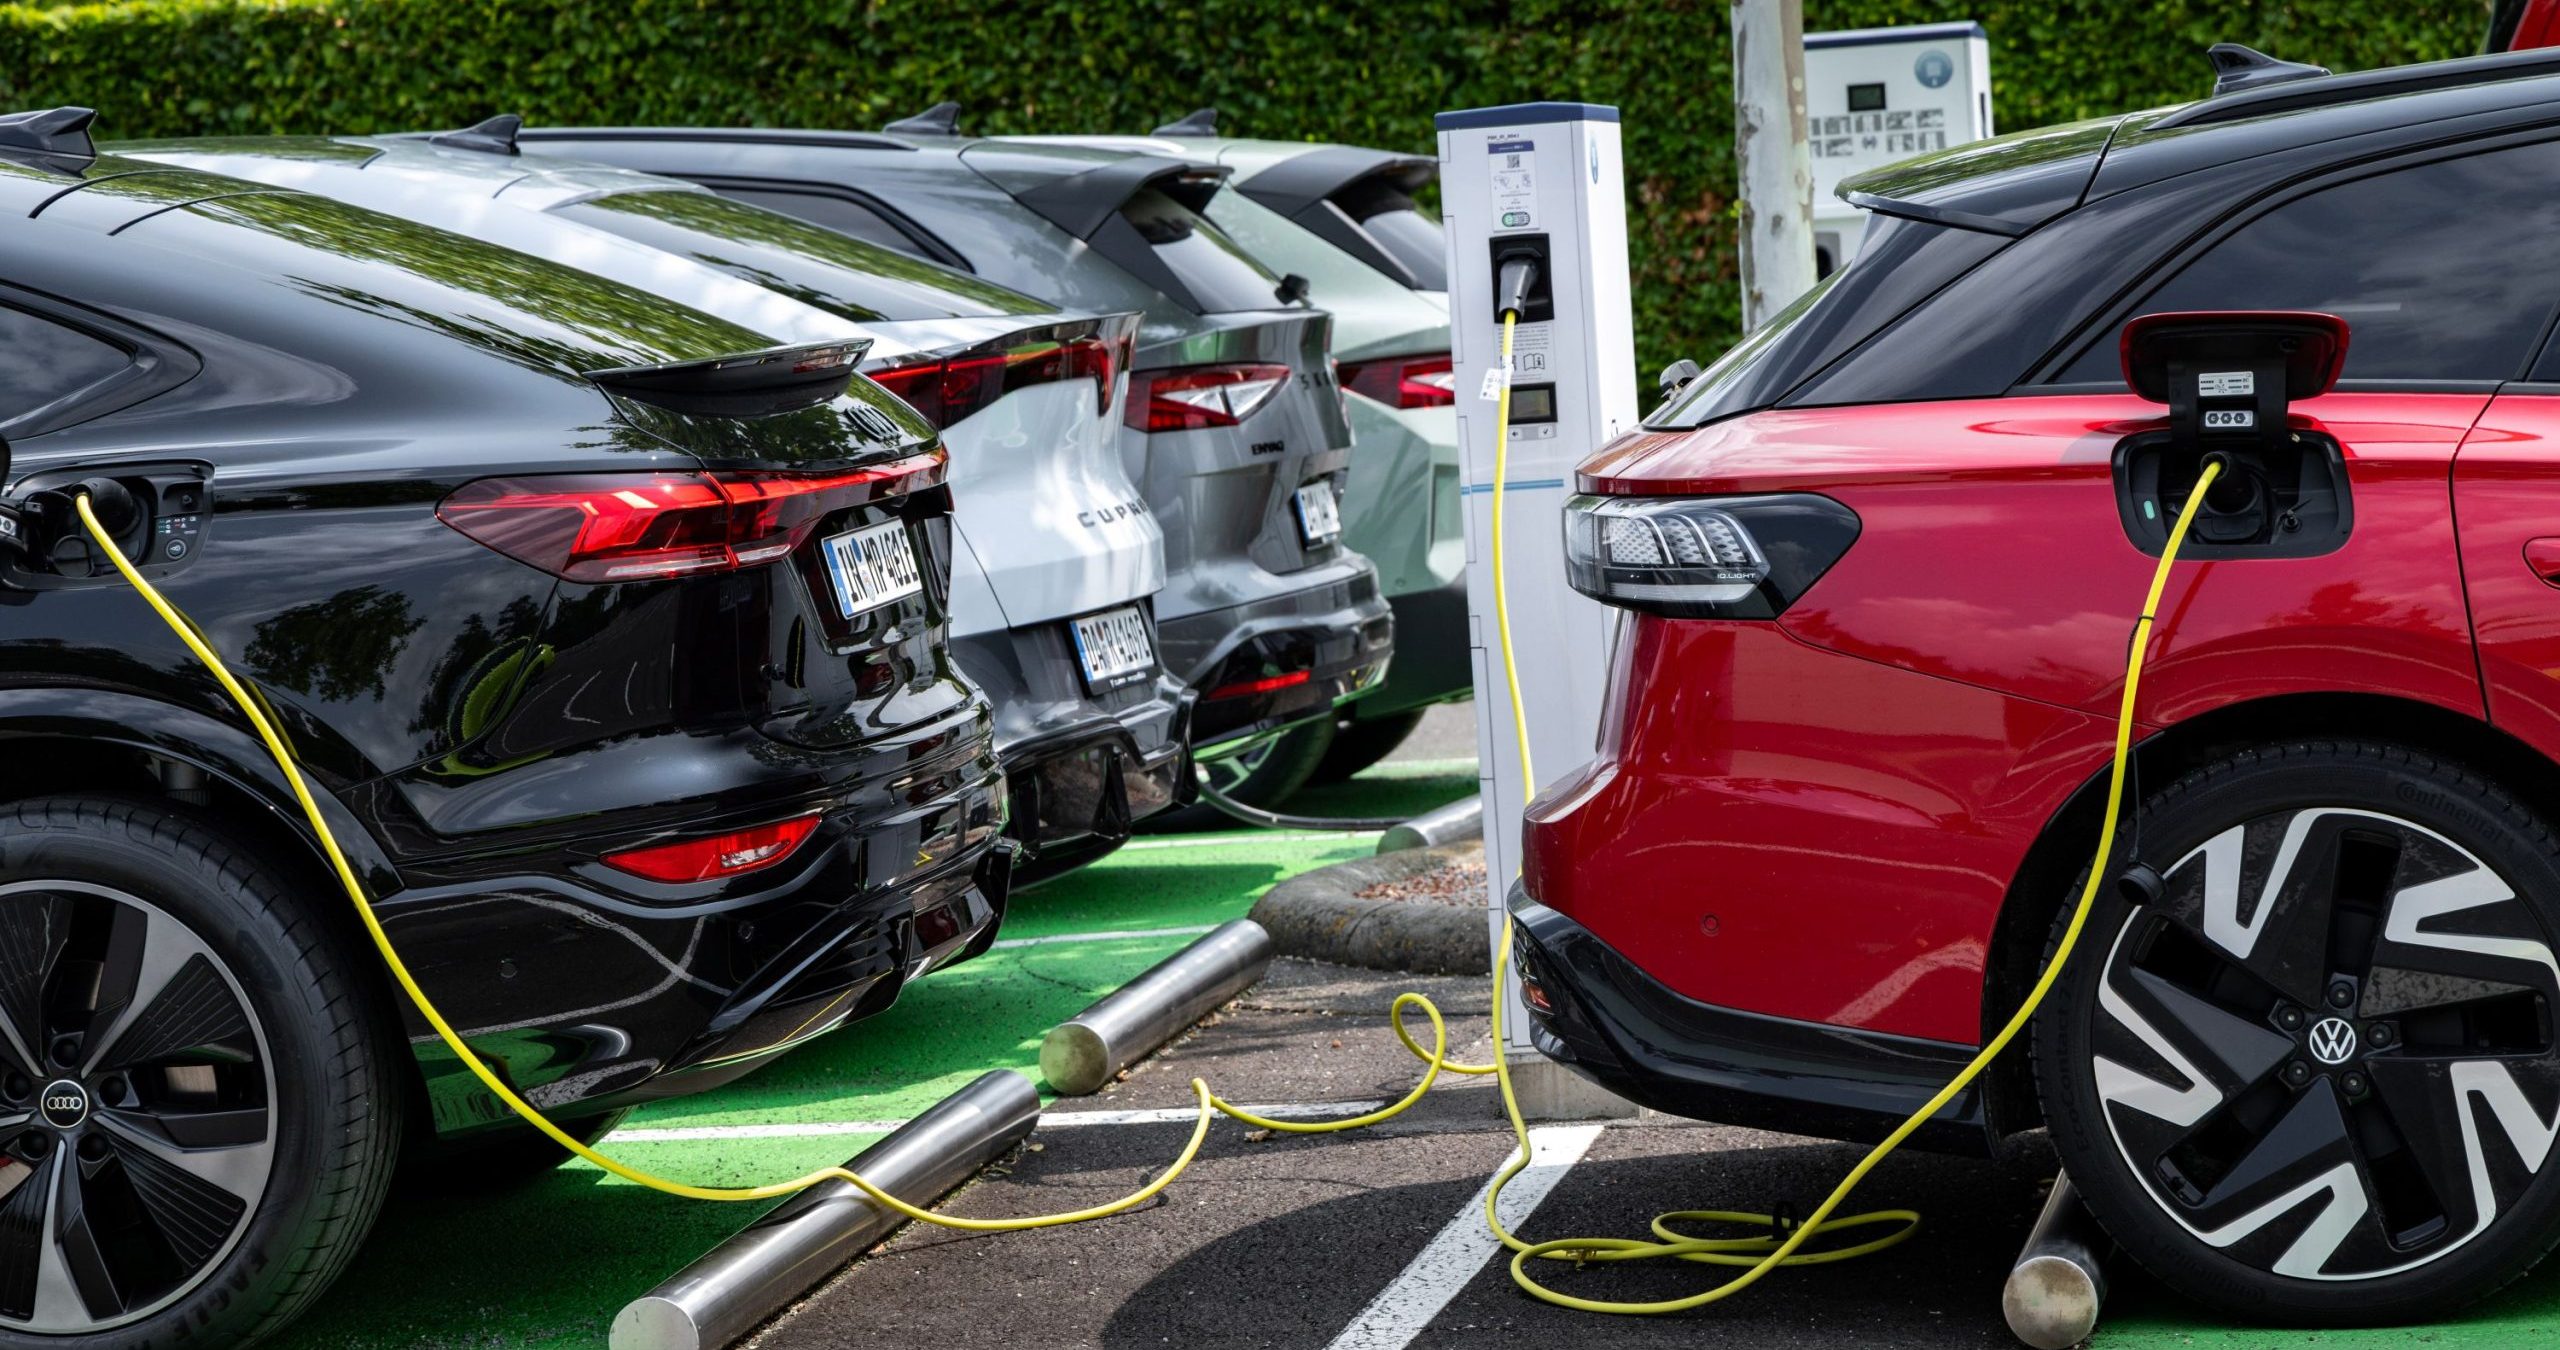
The Volkswagen Group grew deliveries in the first seven months of the year by 1.3 percent compared with the prior year: 5.90 million vehicles were handed over to customers worldwide from January to July. 787,300 vehicles were delivered in the month of July. “Deliveries by the Volkswagen Group in July almost matched the prior-year level and continued the positive trend for the first six months. The Group’s broad brand portfolio is proving to be a great strength”, said Fred Kappler, Head of Group Sales.
2.52 million vehicles were handed over to customers in Europe from January to July, an increase of 2.6 percent compared with the previous year. Group brands delivered 323,800 new vehicles in Europe in July (-4.7 percent). 2.14 million vehicles were handed over to customers in Western Europe in the first seven months of the year (+2.0 percent), while 377,900 (+6.6 percent) units were delivered in Central and Eastern Europe, with Poland and the Czech Republic reporting significant growth.
The company handed over 81,500 vehicles to customers in the North America region in July, slightly down (-0.3 percent) on the previous year. While there was strong growth momentum in Mexico, the downturn on the U.S. market continued in July (-5.1 percent). The macro economic situation in the South America region, particularly in Brazil, remained tense. 37,400 vehicles were delivered in the region in July – a decrease of 23.5 percent.
Solid growth in the Asia-Pacific region continued in July. Deliveries for that month increased by 11.6 percent compared with the previous year to 311,400 units, of which 285,900 (+16.0 percent) were handed over to customers on the Chinese market. 2.35 million vehicles were delivered in the Asia-Pacific region from January to July – an increase of 5.9 percent on the prior-year figure.
Overview of deliveries by the Volkswagen Group:
| Deliveries to customers by markets | July 2016 |
July 2015 |
Change (%) |
Jan.-July 2016 |
Jan.-July 2015 |
Change (%) |
| Europe | 323,800 | 339,900 | -4.7 | 2,519,500 | 2,454,700 | +2.6 |
| Western Europe | 270,200 | 289,400 | -6.6 | 2,141,600 | 2,100,300 | +2.0 |
| Germany | 103,600 | 113,400 | -8.7 | 788,700 | 781,700 | +0.9 |
| Central and Eastern Europe | 53,500 | 50,500 | +6.1 | 377,900 | 354,400 | +6.6 |
| Russia | 13,400 | 13,300 | +0.3 | 91,900 | 97,600 | -5.8 |
| North America | 81,500 | 81,800 | -0.3 | 525,600 | 533,000 | -1.4 |
| USA | 51,300 | 54,000 | -5.1 | 325,100 | 349,000 | -6.8 |
| South America | 37,400 | 48,900 | -23.5 | 261,200 | 346,100 | -24.5 |
| Brazil | 23,900 | 34,100 | -29.8 | 165,700 | 245,900 | -32.6 |
| Asia-Pacific | 311,400 | 279,000 | +11,6 | 2,353,100 | 2,222,500 | +5.9 |
| China | 285,900 | 246,500 | +16,0 | 2,148,000 | 1,989,500 | +8.0 |
| Worldwide | 787,300 | 791,900 | -0.6 | 5,904,100 | 5,831,200 | +1.3 |
| Deliveries to customers by brands | July 2016 |
July 2015 |
Change (%) |
Jan.-July 2016 |
Jan.-July 2015 |
Change (%) |
| Volkswagen Passenger Cars | 449,100 | 457,500 | -1.8 | 3,374,000 | 3,403,200 | -0.9 |
| Audi | 149,400 | 146,100 | +2.3 | 1,102,600 | 1,048,300 | +5.2 |
| ŠKODA | 83,700 | 82,800 | +1.0 | 653,000 | 627,100 | +4.1 |
| SEAT | 34,900 | 34,900 | +0.2 | 251,800 | 251,300 | +0.2 |
| Porsche | 19,300 | 20,700 | -6.8 | 137,300 | 134,700 | +1.9 |
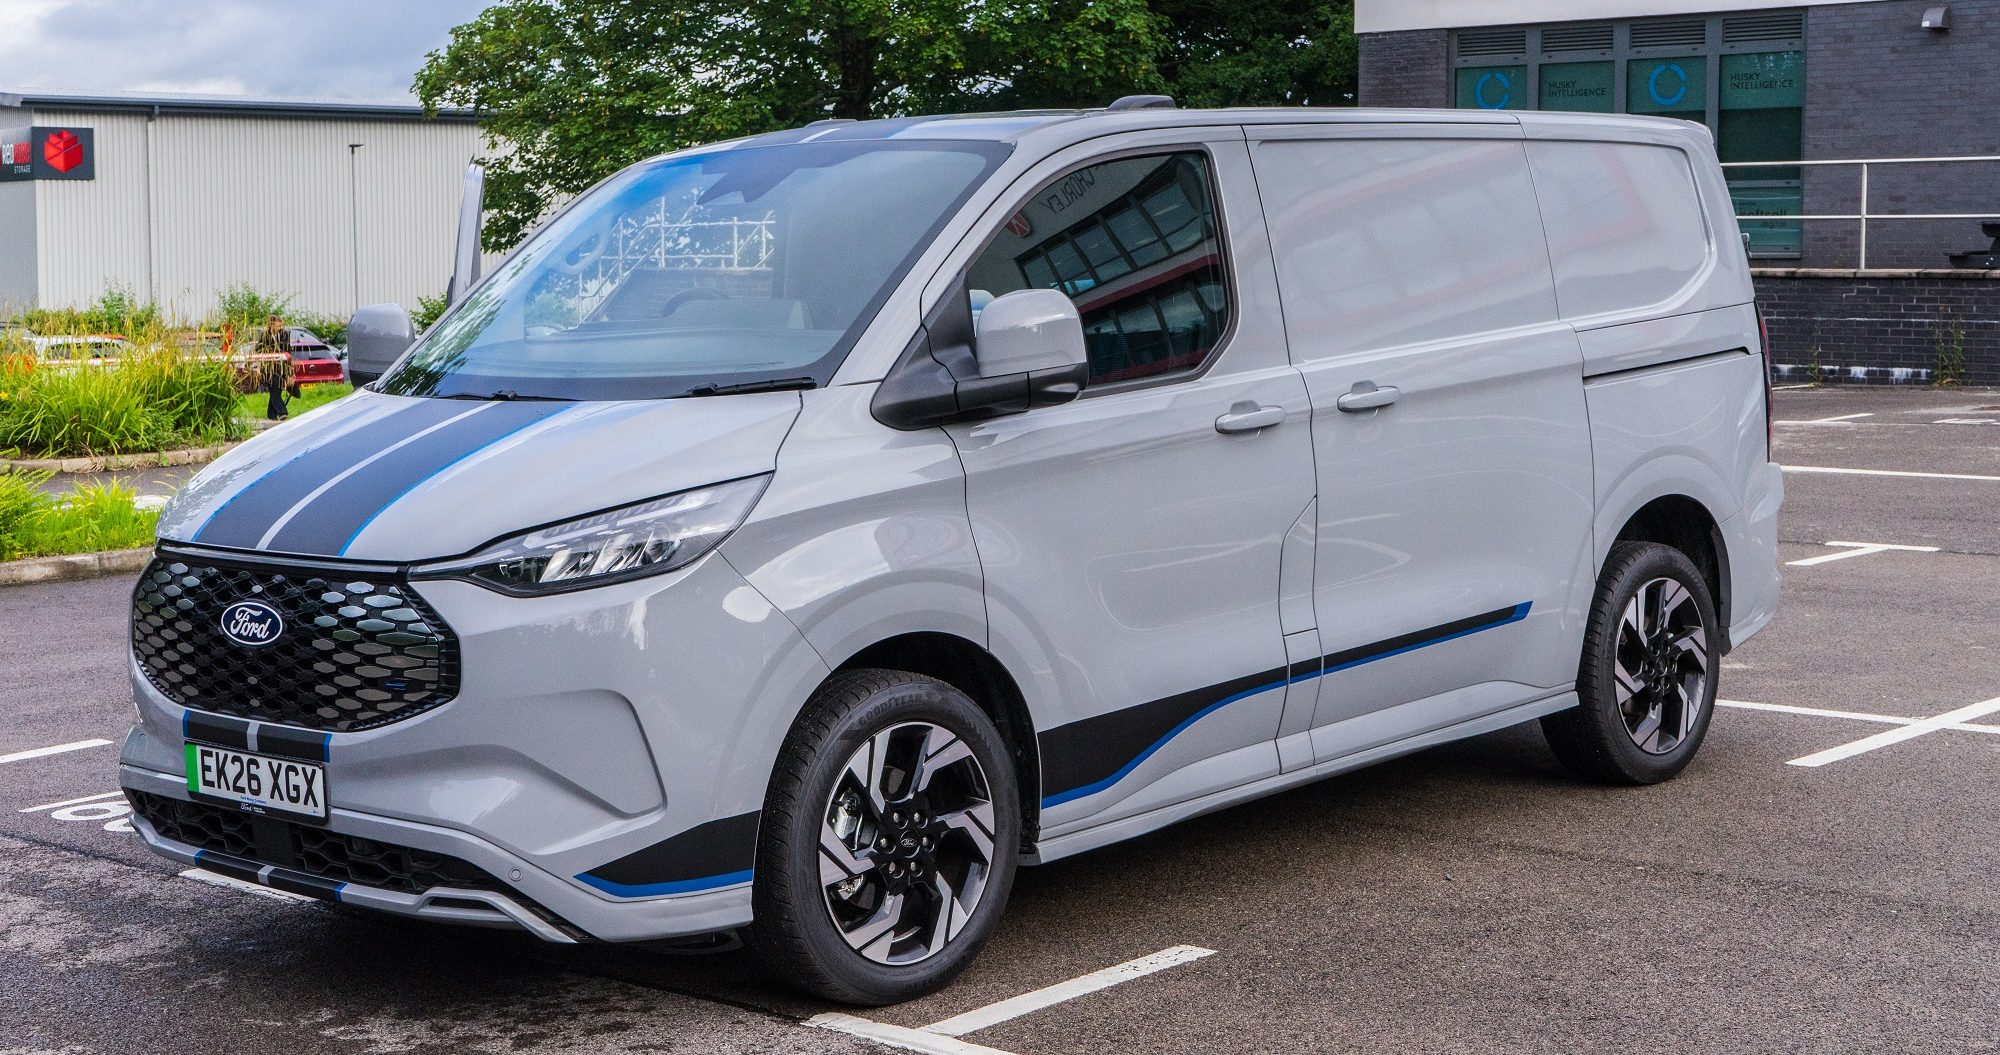
| Volkswagen Commercial Vehicles | 34,500 | 33,700 | +2.2 | 273,300 | 256,900 | +6.4 |
| MAN | 8,700 | 8,700 | +0.1 | 58,000 | 58,600 | -0.9 |
| Scania | 6,600 | 6,400 | +2.9 | 46,900 | 43,400 | +8.1 |
| Volkswagen Group (total) | 787,300 | 791,900 | -0.6 | 5,904,100 | 5,831,200 | +1.3 |


