

As the government announced that they will be bringing forward the plan to ban the sale of conventionally powered vehicles by 2035, new research has revealed the UK could hit its target of ‘most vehicles on the road being low emission’, as early as 2034, however, Brits have major concerns about making the switch.
 The research from leading car parts retailer, Euro Car Parts, looked at the UK as a whole, as well as drilling down into the capital and also the UK’s 10 most congested cities outside of London, to see how prepared they are to make the switch.
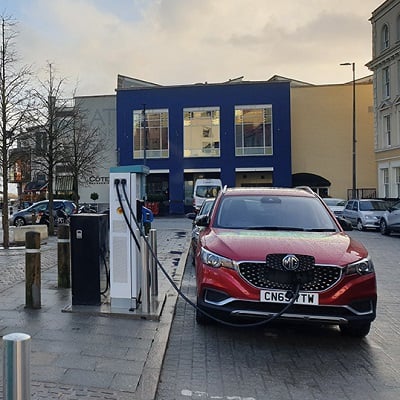
Based on calculations that consider factors such as the population, the amount of public charging points and their increase rate since January 2019, as well as the volume of alternative fuel cars currently registered, the research revealed Southampton will be ready for the electric takeover the quickest1.
The southern city currently has 77 charging points, a 13% increase since January, alongside a relatively low population compared to other major cities and 1,023 alternative fuel cars registered.
London has seen a 66% increase in charging points since the start of the year to almost 4,000, however due to its vast population (9m) and number of electric vehicles already on the road (123k), it still has a long way to go to be completely ready for the electric takeover.
Here are the UK’s most congested cities in order of how ready they are for the electric takeover:

Looking at the UK as a whole, a Department for Transport report in 2018 stated only 2% of registered vehicles were low emission. And while this seems a long way off target, the YoY growth2 shows the UK has had a 37% increase in low emission cars since 2016. If it continues at this rate, the UK will have 38.2m low emission vehicles on the road by 2034, leaving the government hitting its target an impressive 16 years before its 2050 deadline.
Despite the target already predicted to be hit earlier than anticipated, Euro Car Parts’ research revealed the nation’s drivers aren’t quite ready to take the plunge.
The research with 2,000 UK drivers of electric cars highlighted ‘not enough charging points’ and ‘being stranded without charge or accessibility to charging services’, were their main concerns (66%), and according to YouGov3, only 4% would consider purchasing an electric car as their next vehicle.
Looking further into the volume of charging points, the UK has seen an average of 28% increase in charging points being installed YoY since 20164. If this rate continues, the UK is expected to have 322 public charging points per 10,000 low emission vehicles by 2034, suggesting the UK’s roads won’t be fully equipped for the transition, and may not meet day-to-day demand.
The number of charging points weren’t the only concern, with the distance-per-charge a worry for half of motorists (47%), as well as their electricity bills increasing (27%) and it actually being more costly than owning a petrol/diesel vehicle (22%).
Commenting on the findings, Chris Barella, Digital Services Director at Euro Car Parts, says: “It’s interesting to see that while figures suggest the government are on track to hit their low emission vehicle target, perhaps even earlier than anticipated, the nation’s views and attitudes towards alternative fuel vehicles, means we still have a long way to go.
“It seems the biggest concern is the number of charging points and it’s understandable why. If the YoY figures are anything to go by, we simply won’t be equipped to supply the demand, however it’s encouraging the government is increasing its funding for charging points in residential areas. Hopefully seeing more around the country will inspire the nation’s drivers to make the switch and help us to achieve the initiative as early as predicted.”
For more information on how prepared the UK’s major cities are for the electric car takeover, please visit: https://www.eurocarparts.com/blog/the-uk-cities-most-prepared-for-the-electric-car-takeover
1Created by ranking the below factors by capita, giving them a score of 1-10. Number one gets 10 points, number two gets nine points etc.
- Number of charging points (Zap Map)
- 2019 charging points half year increase (%)
- Alternative fuel cars registered (Department of vehicles)
- Population mid 2017 estimate (ONS)
- Alternative fuel cars registered per capita (per 100,000)
- 2019 Charging points per AFC (per 100)
- % agree that electric cars are the future of the motor industry
3YouGov data 19/01/2020
4Calculated by looking at how many charging points there were in 2016, 2017, 2018 and 2019 to reveal a YoY increase


